
As marketers, we’re always wondering to see how we are performing with our ads. While there are several factors to ad performance, from CTR (click through rate) to conversion rates, it’s what determines how we are performing ourselves as marketers. Most times, it’s a team effort that is reflected on a marketing team, other times, its the work of just one person.

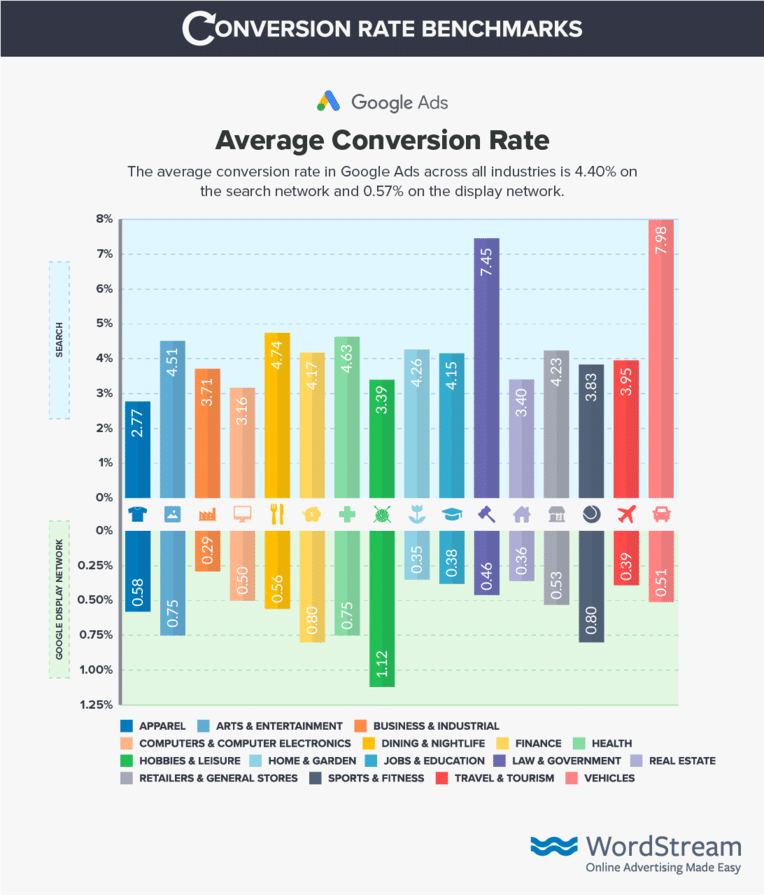
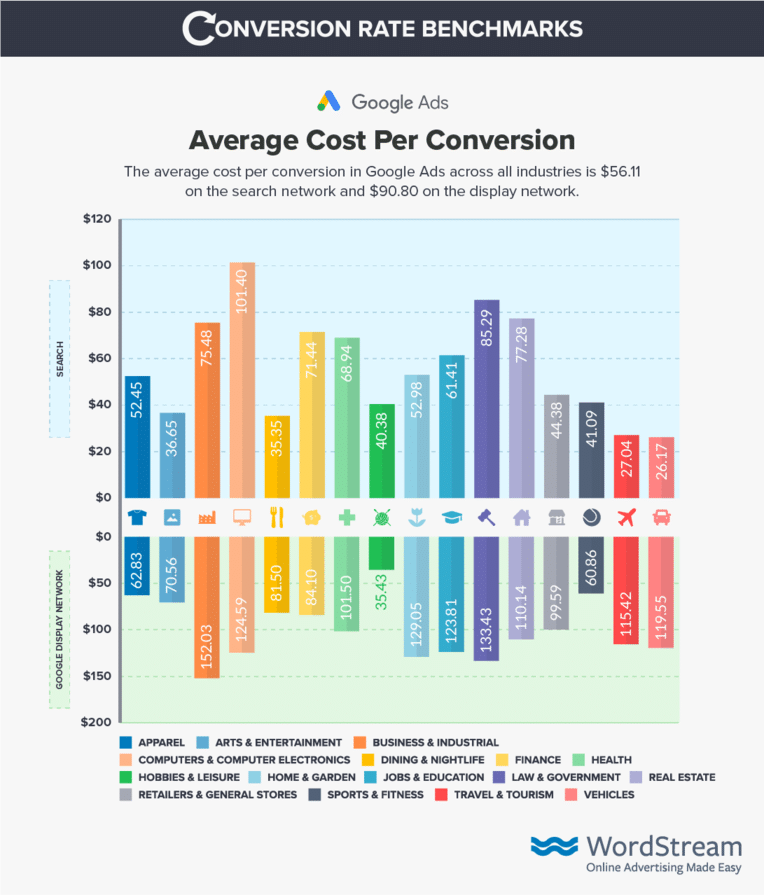
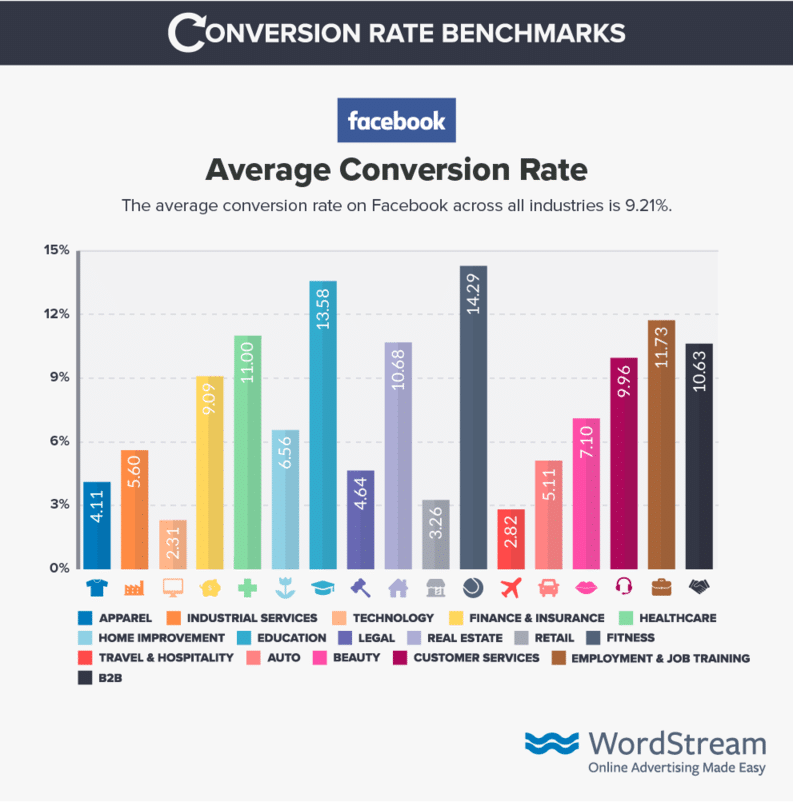
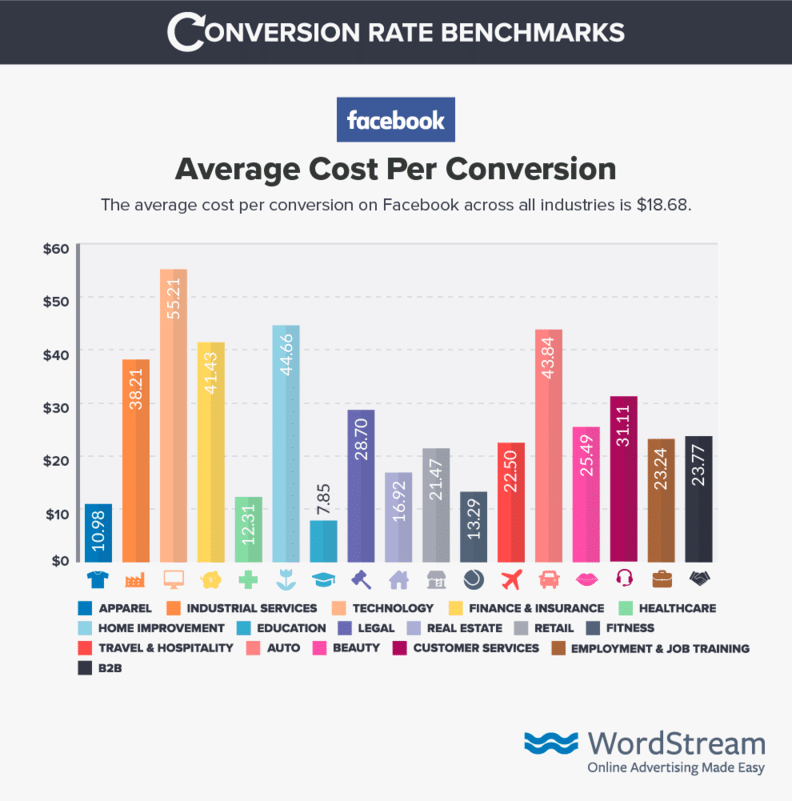
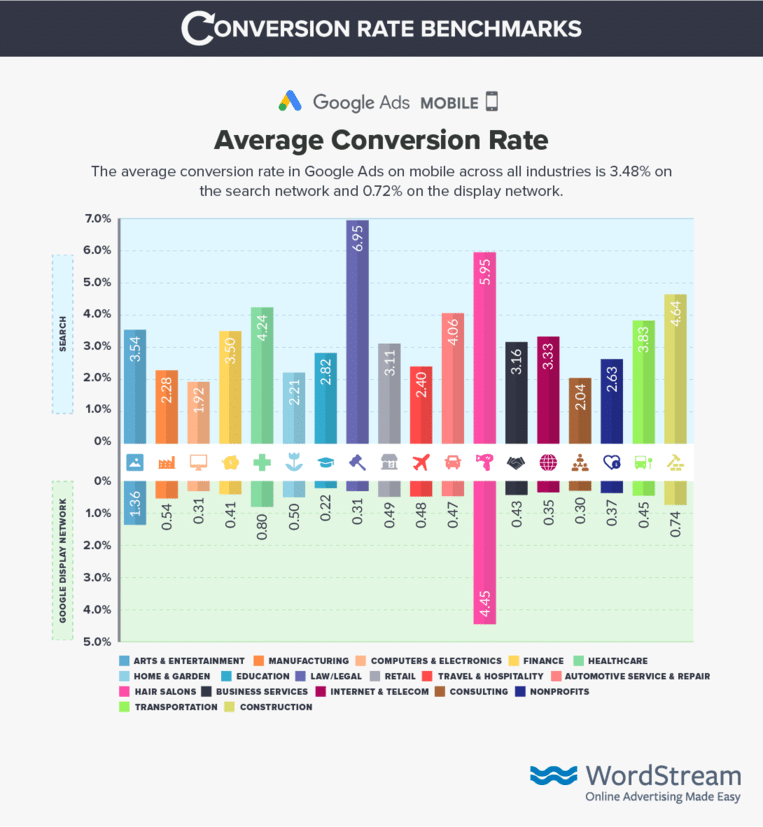
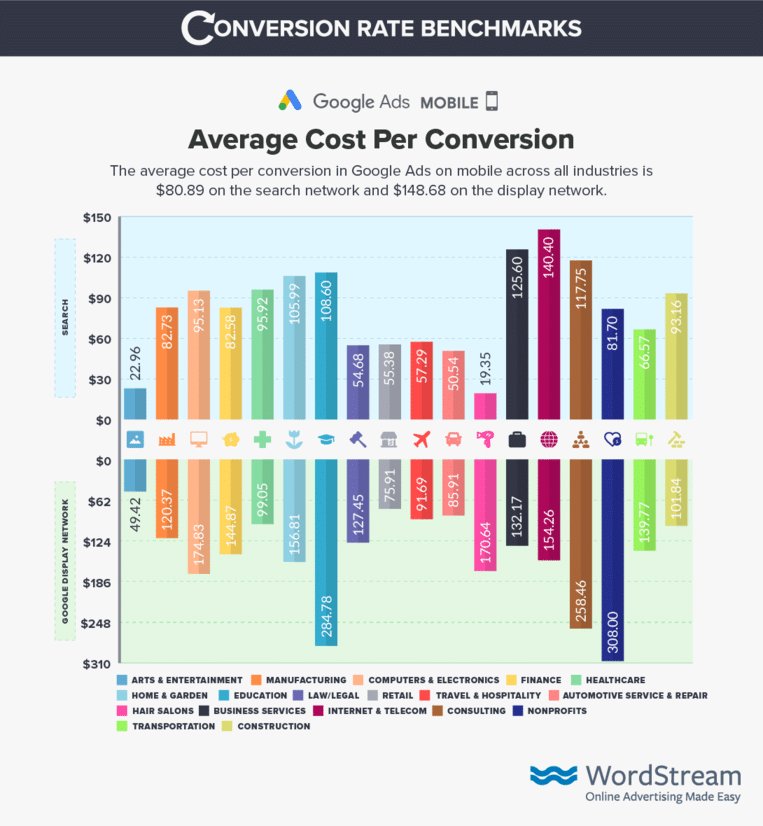
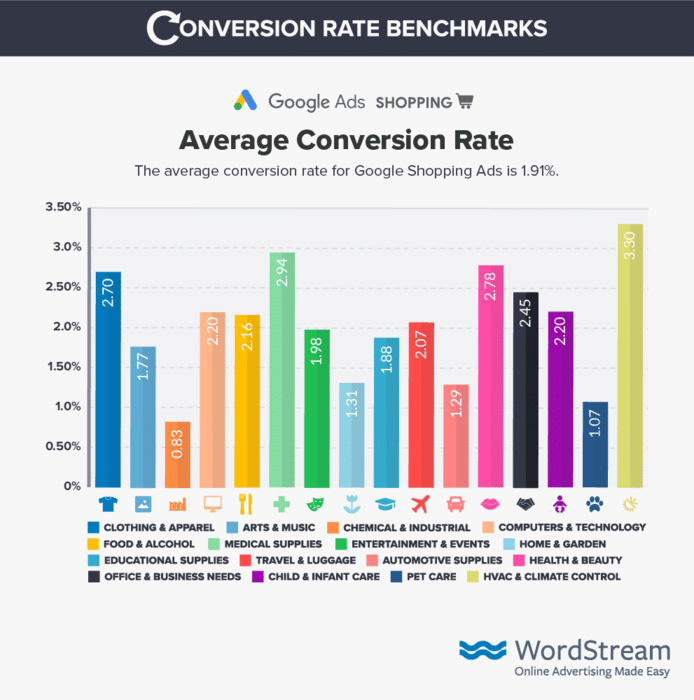
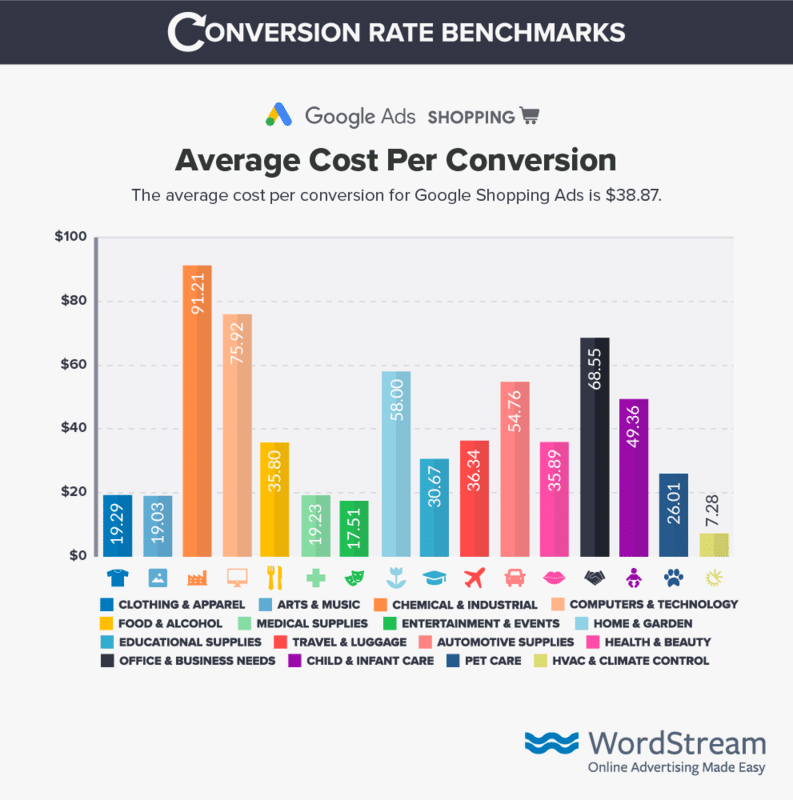
Wordstream published great data that helps us benchmark to see where our current performance is at compared to data from Google & Facebook. This is great data to analyze. Of course, it’s a generalization but gives us a very good glimpse.

As always, you’re constantly optimizing for performance. However, knowing this data, I’m sure, will be extremely helpful.

(This data was taken and updated on July 2020)
* This conversion rate benchmark report is based on performance data pulled from tens of thousands of US-based WordStream customer accounts. 

google ads average conversion rate
The average conversion rate across Google Ads is 4.40% on the search network and 0.57% on the display network.
google ads average cost per conversions
The average cost per conversion across Google Ads is $56.11 on the search network and $90.80 on the display network.
facebook average conversion rate
The average conversion rate across Facebook Ads is 9.21%.
facebook average cost per conversion
The average cost per conversion across Facebook Ads is $18.68.
google ads mobile conversion rate
The average mobile conversion rate across Google Ads is 3.48% on the search network and 0.72% on the display network.
google ads mobile cost per conversion
The average cost per conversion across Google Ads is $80.89 on the search network and $148.68 on the display network.
google ads shopping average conversion rate
The average conversion rate across Google Shopping is 1.91%.
google ads shopping average cost per conversion
The average cost per conversion across Google Shopping is $38.87.