Bounce rate isn’t typically a KPI many businesses look into. Unless you’re an SEO or digital marketer digging into the analytics, it’s one that’s often overlooked as something to either dig into or give it real importance as other KPIs take a lot more focus.
However, I think bounce rate has become an important metric that is not only important, and I’ll tell you why in a second, but it’s also a good measure of content performance. Usually, the conversation about content performance is around CPA but let’s face it, a bounce rate is a good indication of content performance.
WHAT IS BOUNCE RATE? (ACCORDING TO GOOGLE)
A bounce is a single-page session on your site. In Analytics, a bounce is calculated specifically as a session that triggers only a single request to the Analytics server, such as when a user opens a single page on your site and then exits without triggering any other requests to the Analytics server during that session.
Bounce rate is single-page sessions divided by all sessions, or the percentage of all sessions on your site in which users viewed only a single page and triggered only a single request to the Analytics server.
These single-page sessions have a session duration of 0 seconds since there are no subsequent hits after the first one that would let Analytics calculate the length of the session. Learn more about how session duration is calculated.
WHY IS BOUNCE RATE IMPORTANT AND WHY IT MATTERS?
Google has taken this metric as part of its signal to the algorithm on how to rate a specific page. It makes total sense, right? If you have a high bounce rate, it’s telling Google that your page is not giving the user the value it needs so its bouncing out of the page without taking action, on the other hand, a low bounce rate means the user is finding the content useful and taking further action. This is correlated to time on site in my opinion but I’ll write about that in another post (something worth paying attention to and content performance indicator!)
THE BOUNCE RATE GUIDELINE AND CHART
According to GoRocketFuel.com that has done a study into bounce rates, this is what they came up with:
26-40% Bounce Rate = Excellent
41-55% Bounce Rate = Roughly Average
56-70% Bounce Rate = Higher Than Average
70%+ = Poor
EXAMINE YOUR BOUNCE RATE FROM DIFFERENCE PERSPECTIVES
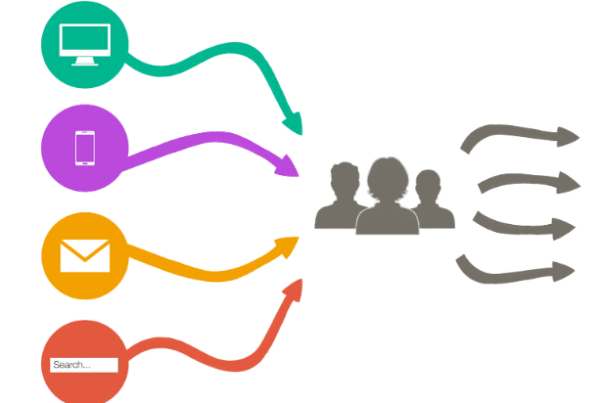
It’s important to note that bounce rate on a single page be attributed to different factors, right? For example, visitors coming in from a search engine as opposed to visitors coming in from an email may have different intent with the content so bounce may vary from channel to channel.
Google Analytics is the perfect place to see bounce from different perspectives.
- The Audience Overview report provides the overall bounce rate for your site.
- The Channels report provides the bounce rate for each channel grouping.
- The All Traffic report provides the bounce rate for each source/medium pair.
- The All Pages report provides the bounce rate for individual pages.
SO…WHAT SHOULD I DO?
Start digging into the bounce rate of your top content and drill down from there. I would see where the high bounce rates are and where I think there is room for improvement on the page such as call to actions, interlinking through the page to offer more value/info to customer, add content such as video that can keep user engaged longer, and other ideas so they dont just…well…leave.
Start this exercise today and track it every 20-30 days to see if small changes are making a difference. At the end of the day, you’re creating a better user experience by optimizing for bounce rate.


